Trade Analysis for Friday:
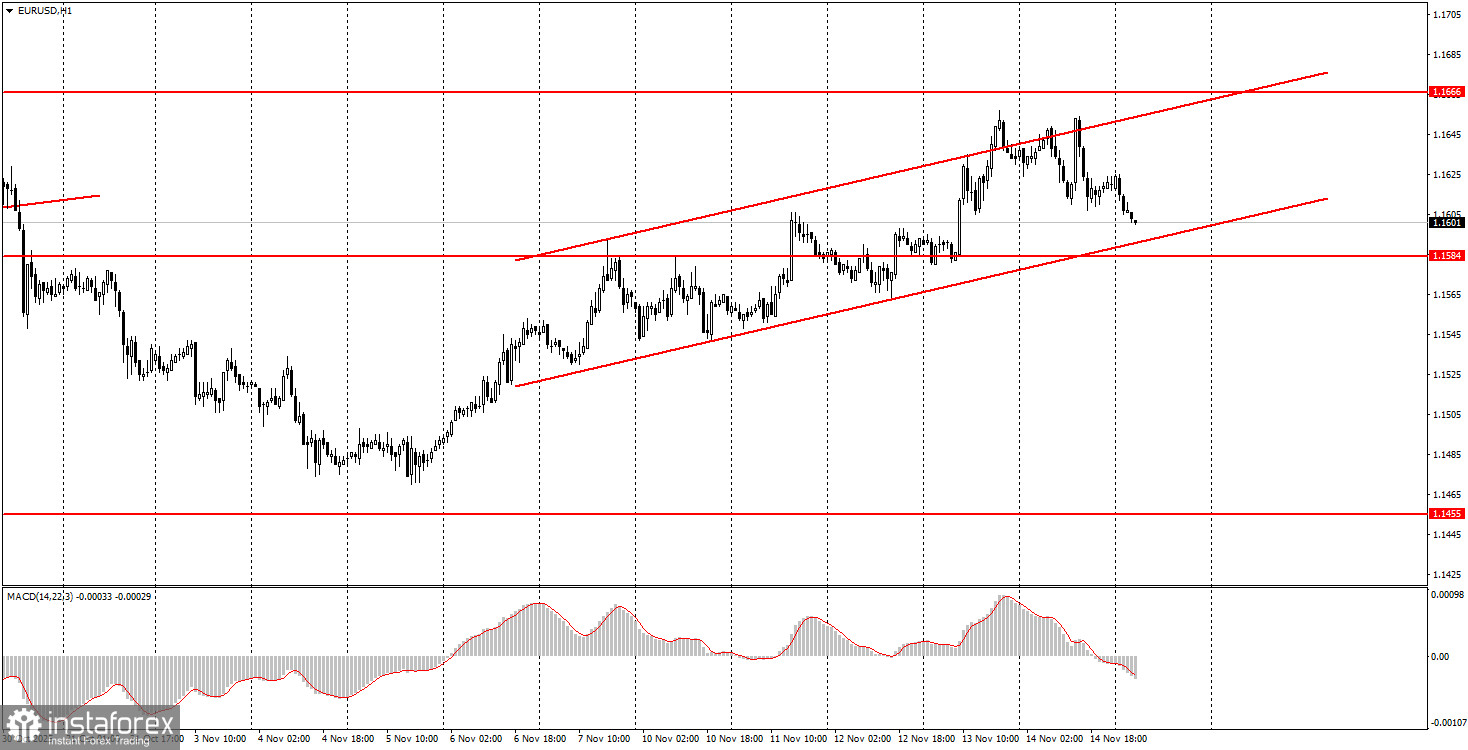
1H Chart for EUR/USD
The EUR/USD currency pair traded predominantly sideways on Friday. There was little macroeconomic data available on that day. Essentially, the only notable data was the Eurozone GDP, which neither disappointed nor pleased the market. Traders still lacked the most critical piece of information—macroeconomic data from the U.S. Individual reports are published occasionally, but they are far from the most significant. The key reports have yet to be released due to the "shutdown." The American government and federal structures resumed operations last week; however, gathering information and data will require considerable time. For example, no important or key reports are scheduled for publication this week. As for the fundamental factors, global ones continue to point north, while the market is ignoring local factors. For instance, the official end of the "shutdown" in the U.S. last week did not support the U.S. currency. Before this, the dollar had performed well for a month and a half while government operations were halted.
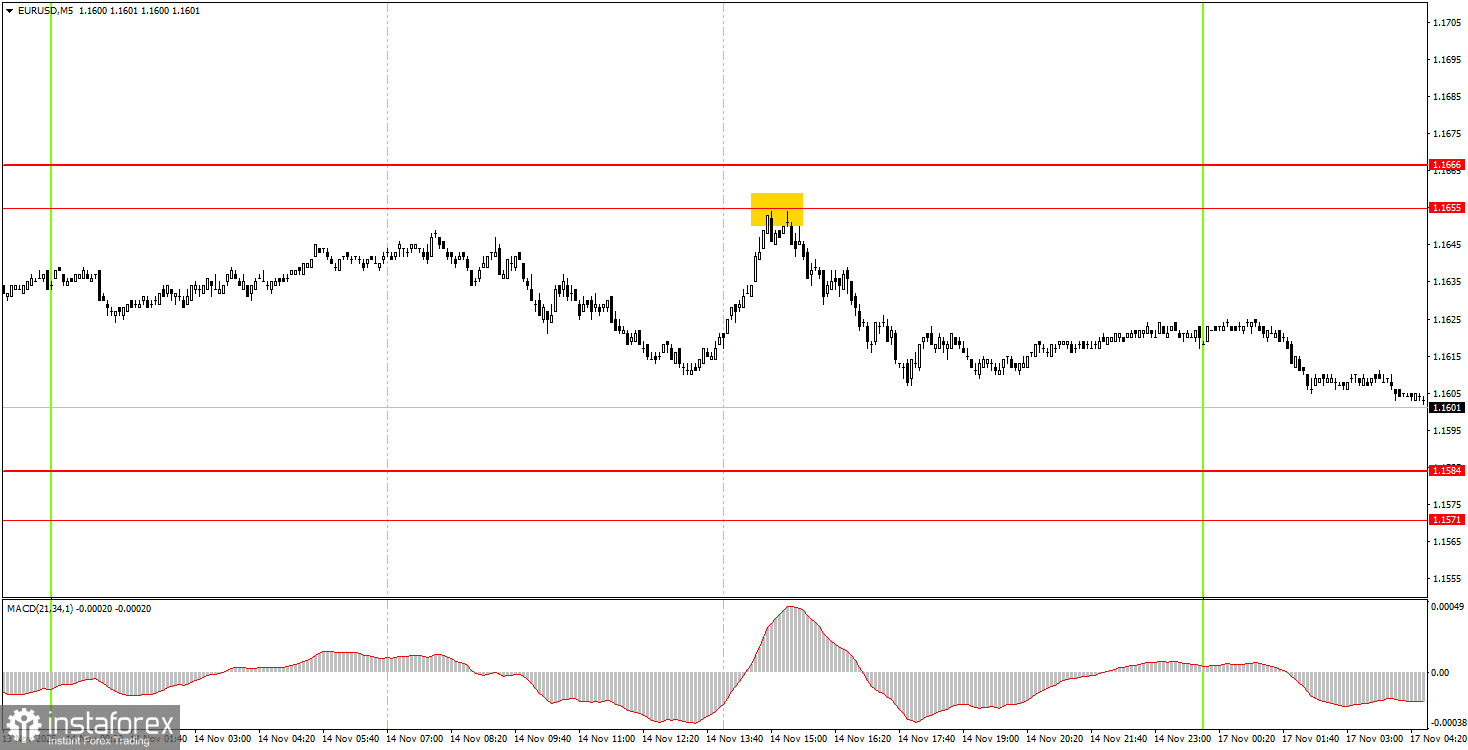
5M Chart for EUR/USD
On the 5-minute timeframe, only one trading signal was formed throughout Friday. At the beginning of the American trading session, the price bounced off the 1.1655 level, then dropped around 30 pips, which novice traders could easily capitalize on with a straightforward signal. With overall volatility around 50 pips, a 30-pip profit is a very good result.
How to Trade on Monday:
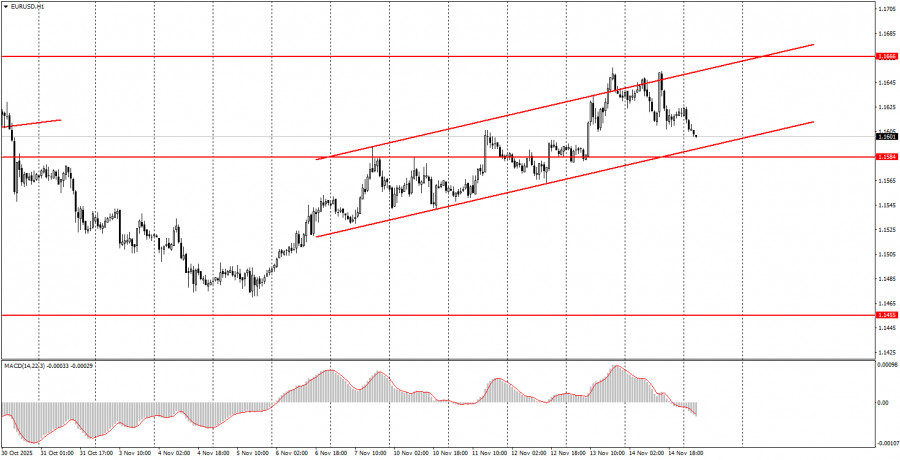
On the hourly timeframe, the EUR/USD pair continues to form a new local upward trend with the potential for another 150-200 pips. The overall fundamental and macroeconomic backdrop remains very weak for the U.S. dollar. Thus, the euro may only show a decline on technical grounds—the flat on the daily timeframe remains relevant. However, we anticipate its completion and a resumption of the upward trend for 2025, and within the flat, there are also upward movements.
On Monday, novice traders can trade from the area of 1.1571–1.1584. A bounce from this area will allow for the opening of long positions with a target of 1.1655. A price consolidation below the 1.1571–1.1584 area will make short positions relevant, with a target at 1.1534.
On the 5-minute timeframe, the following levels should be considered: 1.1354–1.1363, 1.1413, 1.1455–1.1474, 1.1527–1.1531, 1.1571–1.1584, 1.1655–1.1666, 1.1745–1.1754, 1.1808, 1.1851, 1.1908, 1.1970–1.1988. On Monday, no significant reports or events are scheduled in Europe or the U.S. Therefore, the day will likely be characterized by sideways movement and low volatility.
Key Principles of My Trading System:
- The strength of the signal is considered based on the time taken to form the signal (bounce or breach of a level). The less time taken, the stronger the signal.
- If two or more trades have been opened around a certain level based on false signals, all subsequent signals from that level should be ignored.
- In a flat market, any pair can create numerous false signals or may not form them at all. In any case, it's best to stop trading at the first signs of a flat.
- Trading deals are opened during the period between the start of the European session and the middle of the American session, after which all deals should be closed manually.
- On the hourly timeframe, it is preferable to trade based on signals from the MACD indicator only when there is good volatility and a trend that is confirmed by a trend line or trend channel.
- If two levels are too close to each other (between 5 and 20 pips), they should be treated as an area of support or resistance.
- After a 15-pip move in the right direction, a Stop Loss should be set to breakeven.
What the Charts Show:
- Support and resistance price levels are targets for opening buy or sell positions. Take Profit levels can be placed around them.
- Red lines indicate trend channels or trend lines, reflecting the current trend and indicating the preferred trading direction.
- The MACD indicator (14,22,3) — histogram and signal line — is a supplementary indicator that can also be used as a source of signals.
Important announcements and reports (always available in the news calendar) can significantly impact the movement of the currency pair. Therefore, during their release, it is recommended to trade with maximum caution or to exit the market to avoid sharp reversals against the preceding movement.
Beginners trading on the Forex market should remember that not every trade can be profitable. Developing a clear strategy and money management is key to long-term success in trading.