empty
 
 
24.09.2025 09:59 AM
How to trade GBP/USD on September 24th? Simple tips and trade analysis for beginners.

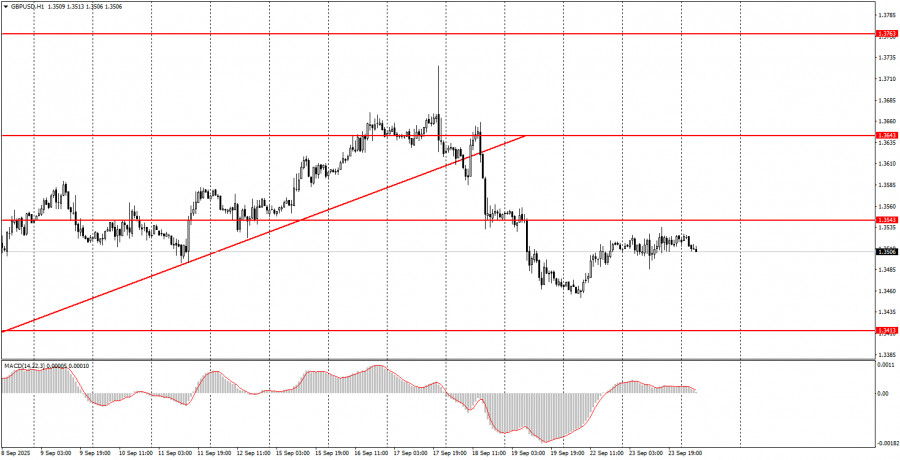
Tuesday's trade analysis: GBP/USD 1H chart

This image is no longer relevant

On Tuesday, the GBP/USD pair stood still all day despite a rather resonant UK macroeconomic background. Recall that last week, most of the UK's economic data turned out quite positive. At the very least, much weaker values could have been expected. However, this week the business activity indices in the services and manufacturing sectors were published, showing weaker-than-expected results. Thus, yesterday the British pound had every reason to fall. The U.S. dollar also had reasons, as American business activity indices also showed a slowdown. The absence of a decline in the dollar can still be explained by the low importance of these indices (since the U.S. publishes the more significant ISM indices), but the market's disregard of UK indices may indicate that the pound's decline has ended. On the hourly timeframe, the downtrend remains, but there is still no trendline.

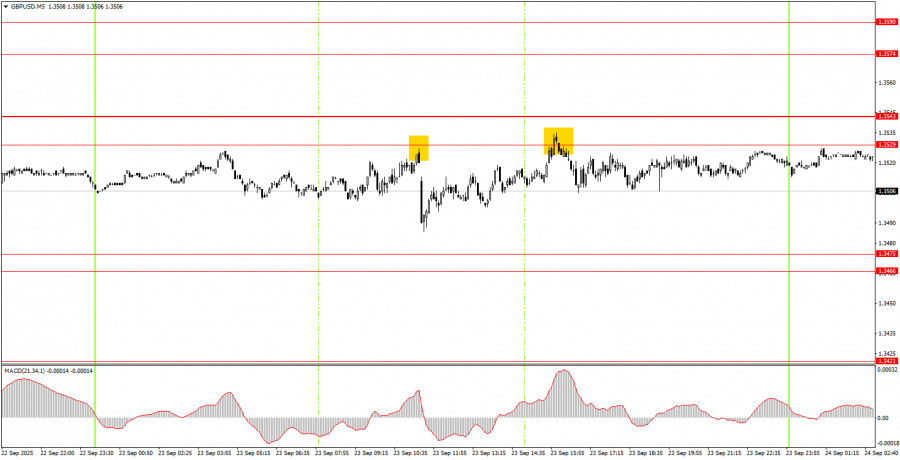
GBP/USD 5M chart

This image is no longer relevant

On the 5-minute timeframe, two sell signals were formed on Tuesday in the 1.3529–1.3543 level. In both cases, the price moved downward by 10–20 points, while the overall daily volatility was extremely low. Thus, the problem was not the signals but the lack of movement itself. Signals can be generated, but if there is no movement, there can be no profit.

How to trade on Tuesday On the hourly timeframe, the GBP/USD pair consolidated below the trendline, so a new technical correction is possible after several weeks of growth. As we have already mentioned, we see no grounds for medium-term growth of the dollar, so in the medium term we expect only upward movement. The daily chart clearly shows the current trend.

On Wednesday, the GBP/USD pair may resume its decline. A rebound from the 1.3529–1.3543 level will allow new short positions with a target at 1.3466–1.3475. In fact, there have already been several such rebounds. New long positions can be opened if the price closes above the 1.3529–1.3543 level, with a target at 1.3574–1.3590.

On the 5-minute timeframe, trading can currently be done based on the following levels: 1.3102–1.3107, 1.3203–1.3211, 1.3259, 1.3329–1.3331, 1.3413–1.3421, 1.3466–1.3475, 1.3529–1.3543, 1.3574–1.3590, 1.3643–1.3652, 1.3682, 1.3763. On Wednesday, no important events or publications are scheduled in either the UK or the U.S. Thus, traders will have nothing to react to unless Donald Trump once again takes center stage. Volatility may again be low, with no real movement during the day.

Basic rules of the trading system:

  1. The strength of a signal is determined by the time it took to form (bounce or breakout of a level). The less time it takes, the stronger the signal.
  2. If two or more false signals appear at the same level, all subsequent signals from that level should be ignored.
  3. In flat conditions, any pair can generate many false signals or none at all. In any case, at the first signs of a flat, it is better to stop trading.
  4. Trades are opened between the start of the European session and the middle of the U.S. session, after which all trades should be closed manually.
  5. On the hourly timeframe, signals from the MACD indicator are preferable only when there is good volatility and a trend confirmed by a trendline or trend channel.
  6. If two levels are too close together (5–20 points), they should be treated as a support or resistance zone.
  7. When the price has moved 20 points in the right direction, set Stop Loss to breakeven.

What's on the chart:

  • Support and resistance price levels – target levels for opening buy or sell positions. Take Profit levels can be placed near them.
  • Red lines – channels or trendlines that reflect the current trend and show the preferred trading direction.
  • MACD indicator (14,22,3) – histogram and signal line – an auxiliary indicator that can also be used as a source of signals.
  • Important speeches and reports (always listed in the news calendar) can strongly affect the pair's movement. During their release, it is recommended to trade with maximum caution or exit the market to avoid a sharp price reversal against the preceding movement.

Beginner forex traders should remember that not every trade can be profitable. Developing a clear strategy and practicing money management are the keys to long-term success in trading.

Paolo Greco,
InstaForex के विश्लेषणात्मक विशेषज्ञ
© 2007-2025
Summary
Urgency
Analytic
Stanislav Polyanskiy
Start trade
Earn on cryptocurrency rate changes with InstaForex
Download MetaTrader 4 and open your first trade
  • Grand Choice
    Contest by
    InstaForex
    InstaForex always strives to help you
    fulfill your biggest dreams.
    कॉन्टेस्ट में हिस्सा लें
  • चैन्सी डिपॉजिट
    $ 3,000 के साथ अपना खाता जमा करें और प्राप्त करें $3000 अधिक!
    में सितंबर हम आकर्षित करते हैं $3000 चैंसी डिपॉज़िट में
    ट्रेडिंग अकाउंट में $ 3,000 जमा करके जीतने का अवसर प्राप्त करें इस शर्त को पूरा करके आप प्रतियोगिता में भाग ले सकते हैं
    कॉन्टेस्ट में हिस्सा लें
  • ट्रेड वाइज़, विन डिवाइस
    कम से कम $500 के साथ अपने खाते में टॉप अप करें, कॉन्टेस्ट के लिए साइन अप करें और मोबाइल डिवाइस जीतने का मौका पाएं।
    कॉन्टेस्ट में हिस्सा लें
  • 100% बोनस
    अपनी जमा राशि पर 100% बोनस प्राप्त करने का आपका अनूठा अवसर
    बोनस पायें
  • 55% बोनस
    अपनी प्रत्येक डिपॉजिट पर 55% बोनस के लिए आवेदन करें
    बोनस पायें
  • 30% बोनस
    हर बार खाता टॉप अप करने पर 30% बोनस प्राप्त करें
    बोनस पायें

अनुशंसित लेख

अभी बात नहीं कर सकते?
अपना प्रश्न पूछें बातचीत.
Widget callback