GBP/USD 5M analysis
The GBP/USD currency pair was also trading in a convulsive manner on Tuesday, although the pound again had every chance to show a decline. In the UK, September business activity indices were also published yesterday, but unlike the European indices, both collapsed. Declines were recorded in both sectors. However, in the second half of the day it should have been the U.S. dollar's turn to fall, since American business activity indices also came out weak. The dollar was saved from this fate only by the fact that ISM indices matter more in the U.S., while the S&P indices, although they declined, still remained above the 50.0 level. Overall, by the end of the day the pound could have fallen, but managed to hold back, which gives hope for the recovery of the upward trend.
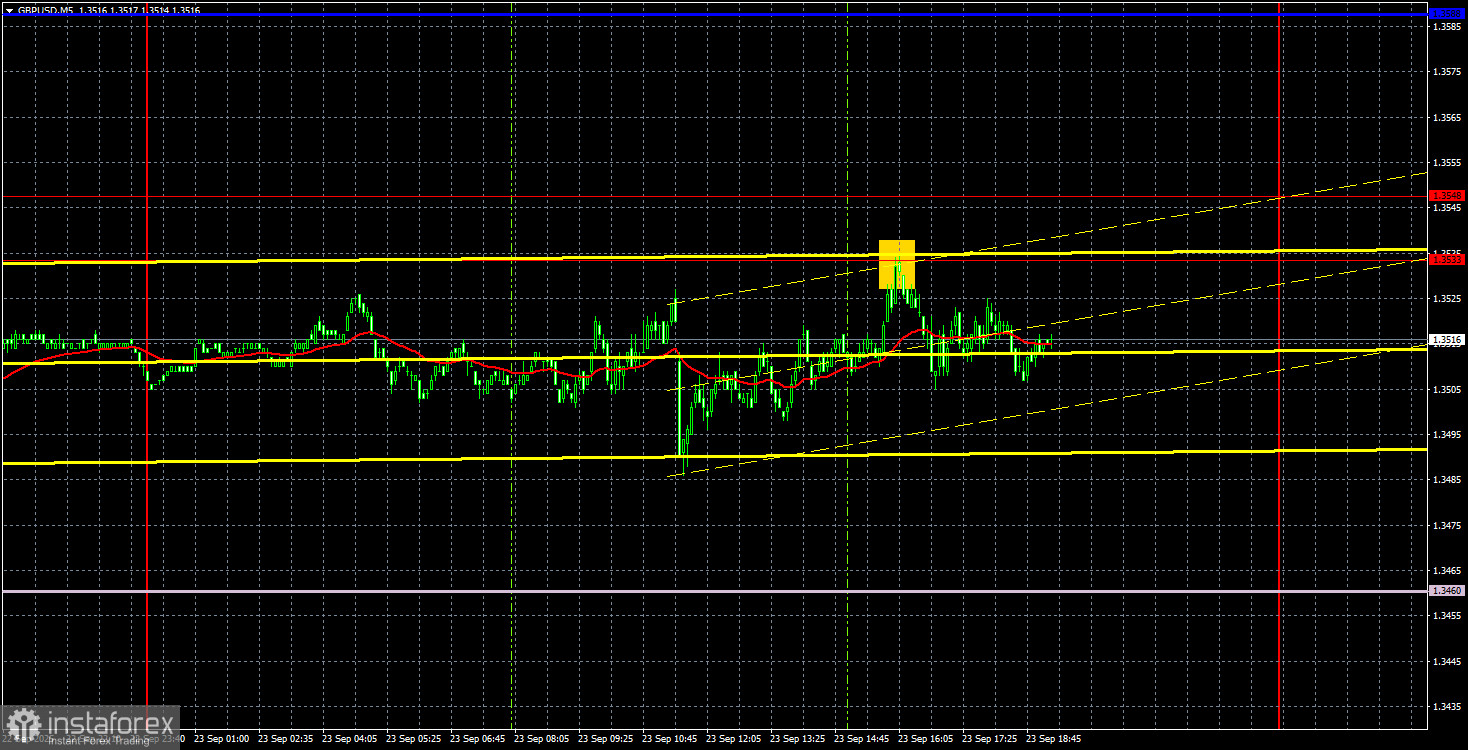
From a technical perspective, the upward trend may still be preserved — or a new one may begin. The price failed to overcome the Senkou Span B line, so growth of the British currency is possible in the near future. Now traders need to break through the 1.3533–1.3548 level and then the Kijun-sen line. We believe this is quite realistic. In recent days, the pound has been under justified market pressure, but the global fundamentals still remain on its side.
On the 5-minute timeframe, only one trading signal was formed yesterday. During the U.S. session, the price bounced from the 1.3533 level but managed to move downward by no more than 15–20 points. There could not have been a loss on this trade, as the price barely moved either up or down.
COT reports on the British pound show that in recent years the sentiment of commercial traders has been constantly shifting. The red and blue lines, which reflect the net positions of commercial and non-commercial traders, intersect all the time and in most cases remain close to the zero mark. Right now, they are practically at the same level, which indicates an approximately equal number of long and short positions.
The dollar continues to decline due to Donald Trump's policies, so in principle, demand from market makers for the pound is not of great importance now. The trade war will continue in one form or another for a long time. The Fed will in any case cut rates within the next year. Demand for the dollar will continue to decline. According to the latest report on the British pound, the "Non-commercial" group opened 5.9 thousand buy positions and closed 21.1 thousand sell positions. Thus, the net position of non-commercial traders rose by 27 thousand positions for the week.
In 2025 the pound will rise sharply, but it should be understood that there is only one reason — Donald Trump's policies. Once this factor is neutralized, the dollar may resume growth, but no one knows when this will happen. It does not matter how fast the net position in the pound rises or falls. For the dollar, it is falling anyway, and usually at a faster pace.
GBP/USD 1H analysis
On the hourly timeframe, the GBP/USD pair retreated last week due to a negative fundamental background. It can be said that a new downward trend has begun. The Senkou Span B line keeps the British currency in play, but a break below it will open new prospects for decline. The dollar still has no global reasons to strengthen, so we expect the resumption of the 2025 upward trend.
For September 24, we highlight the following important levels: 1.3125, 1.3212, 1.3369–1.3377, 1.3420, 1.3533–1.3548, 1.3584, 1.3681, 1.3763, 1.3833, 1.3886. The Senkou Span B line (1.3460) and the Kijun-sen line (1.3586) may also serve as sources of signals. A Stop Loss level is recommended to be moved to breakeven after the price has gone 20 points in the correct direction. Ichimoku indicator lines may shift during the day, which should be taken into account when identifying trading signals.
On Wednesday, no interesting events or publications are scheduled in either the UK or the U.S. During the day, volatility may again be low, and trend movement absent.
Trading recommendations: Today traders may count on continued growth, but a break above the 1.3533–1.3548 level is required. A rebound from this area would allow for opening short positions with the target at 1.3460.
Explanations for illustrations:
- Support and resistance price levels – thick red lines where movement may end. Not sources of trading signals.
- Kijun-sen and Senkou Span B lines – Ichimoku indicator lines transferred to the hourly timeframe from the 4-hour chart. Strong lines.
- Extreme levels – thin red lines from which the price previously bounced. Sources of trading signals.
- Yellow lines – trend lines, trend channels, and any other technical patterns.
- Indicator 1 on COT charts – the size of the net position of each trader category.