Analysis of Monday's Trades:
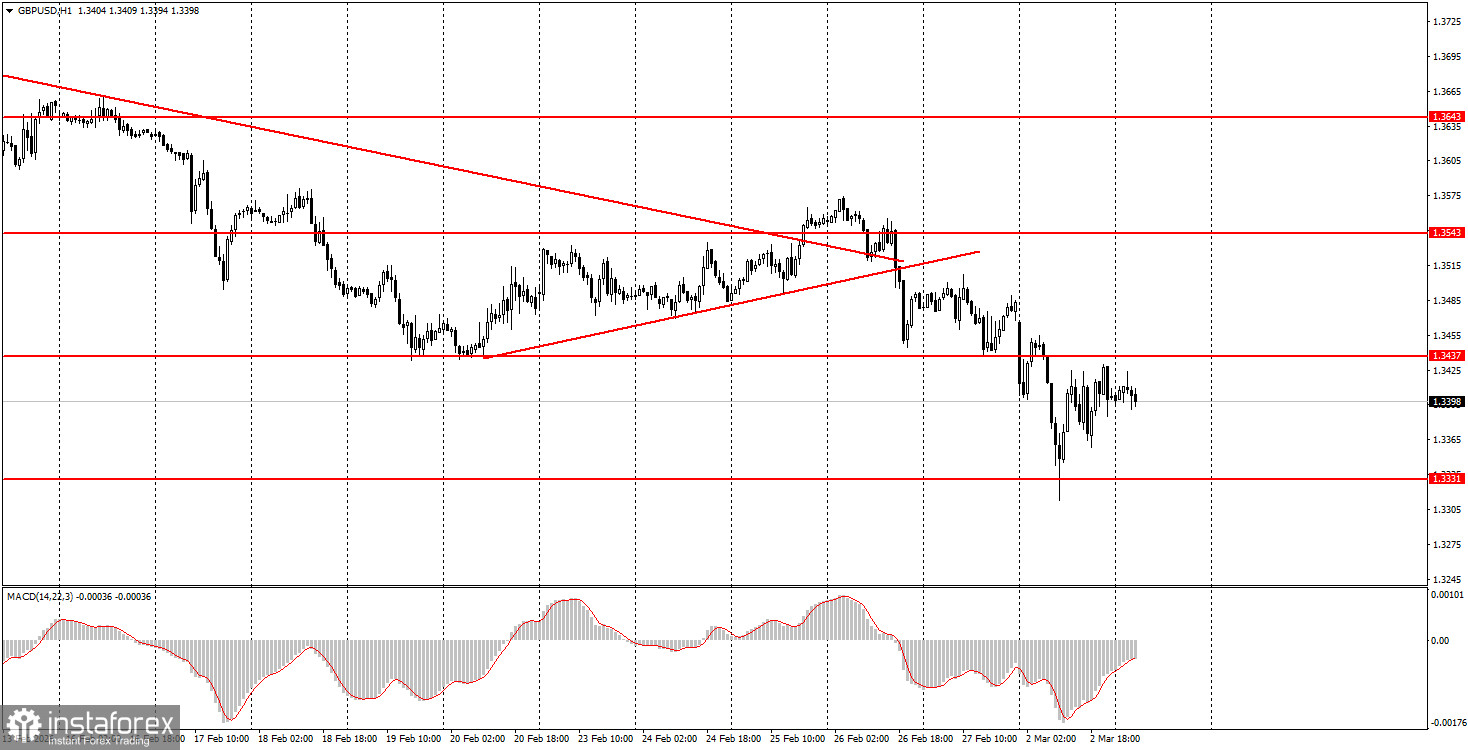
1H Chart of the GBP/USD Pair
The GBP/USD pair also traded lower on Monday, but the nature of the movements was somewhat different. Throughout the day, the British pound fluctuated, with volatility high. As a result, we saw a large number of trading signals, and in the second half of the day, the pound recovered more actively than the euro. However, this recovery does not mean that all the troubles for the British currency are behind it. Over the last month and a half, almost every event or report has weighed on the British pound. Overall, the fundamental background is not so bad for the British currency. To be more precise, it is not good enough for the dollar to rise so confidently in the US. But each time a new event provokes a strengthening of the dollar. Even the geopolitical conflict in Iran is an event whose market reaction could not be predicted. If the dollar hadn't risen on Monday, we wouldn't have been surprised either, as the market had been expecting and preparing for war in the Middle East for the past two weeks.
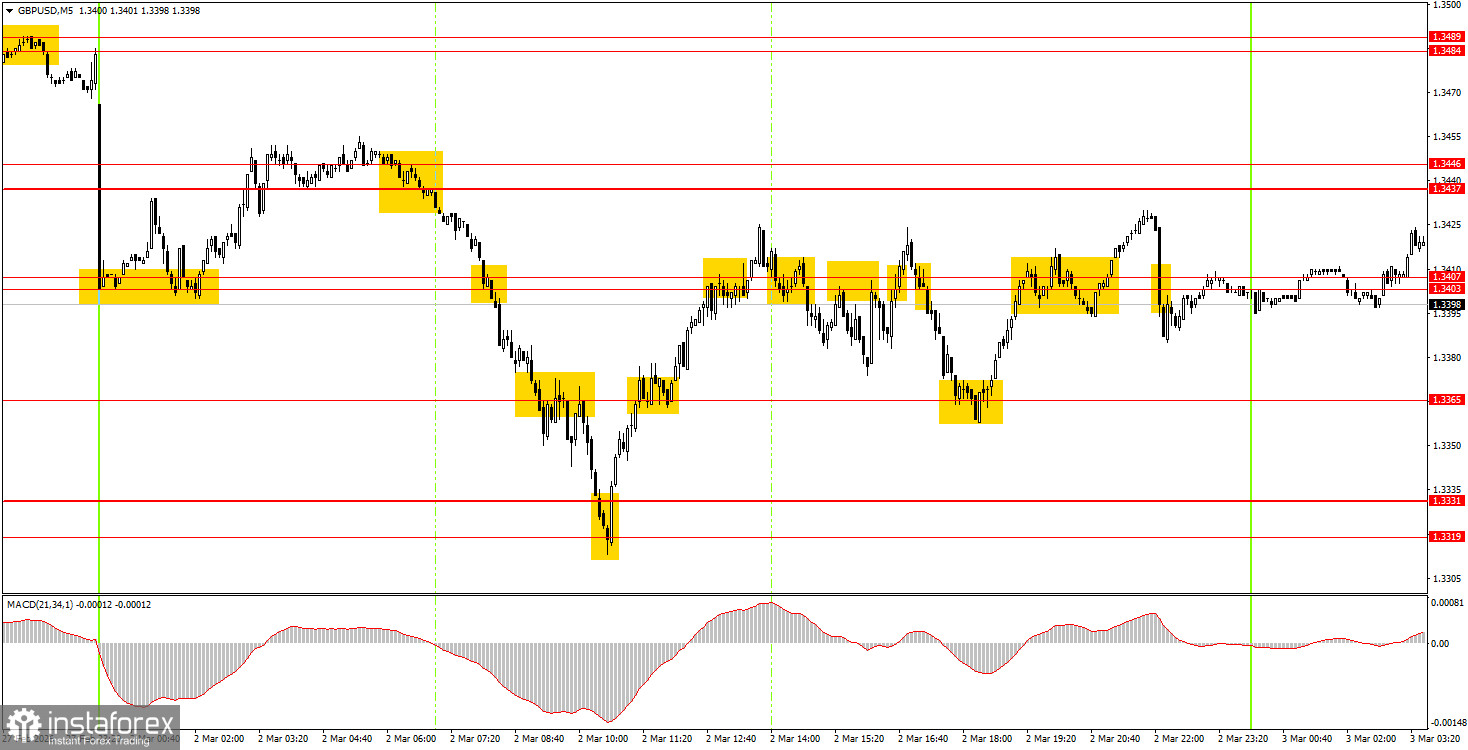
5M Chart of the GBP/USD Pair
On the 5-minute timeframe, more than 10 trading signals were formed on Monday. We won't list them all; we'll just say that during the European trading session alone, beginner traders could earn about 120-130 pips from just two trades. As soon as the pair began to move more actively, profits appeared immediately. In the second half of the day, the movements were chaotic, so some signals proved false. There was a full-blown storm in the market on the first trading day of the week, not only in the currency market.
How to Trade on Tuesday:
On the hourly timeframe, the GBP/USD pair broke the downward trend and immediately broke a new upward trend. There are no global grounds for medium-term dollar growth, so in 2026, we expect the continuation of the global upward trend of 2025, which could bring the pair to at least 1.4000. In recent weeks, situations have often developed not in favor of the British currency, and the market has often ignored negative news from America, which has ensured the growth of the American currency.
On Tuesday, beginner traders can open long positions if the price breaks through the area of 1.3437-1.3446 with a target of 1.3484-1.3489 and above. A consolidation below the area of 1.3403-1.3407 will allow opening new shorts with targets of 1.3365 and 1.3319-1.3331.
On the 5-minute timeframe, trading can now be conducted at levels 1.3203-1.3212, 1.3259-1.3267, 1.3319-1.3331, 1.3365, 1.3403-1.3407, 1.3437-1.3446, 1.3484-1.3489, 1.3529-1.3543, 1.3643-1.3652, 1.3695, 1.3741-1.3751, 1.3814-1.3832. On Tuesday, no important events are scheduled in the UK and the US. However, the market may remain in a state of storm due to events in the Middle East.
Key Principles of the Trading System:
- The strength of a signal is determined by the time it takes to form the signal (bounce or breakout). The less time taken, the stronger the signal.
- If two or more trades have been opened at a particular level based on false signals, all subsequent signals from that level should be ignored.
- In a flat market, any pair can form many false signals or none at all. In any case, at the first signs of a flat trend, it is best to stop trading.
- Trading deals are to be opened during the period between the start of the European session and the mid-American session, after which all trades should be closed manually.
- On the hourly timeframe, it is preferable to trade based on signals from the MACD indicator only when there is good volatility and a trend confirmed by a trend line or trend channel.
- If two levels are positioned too close together (5-20 pips apart), they should be considered a support or resistance area.
- Upon moving 20 pips in the correct direction, a Stop Loss should be set to breakeven.
What to Look for on the Charts:
Price levels of support and resistance are levels that serve as targets when opening buys or sells. Take Profit levels can be placed around them.
Red lines represent channels or trend lines that show the current trend and indicate the direction in which it is preferable to trade now.
The MACD indicator (14,22,3) – the histogram and the signal line – is a supporting indicator that can also be used as a source of signals.
Important speeches and reports (always included in the news calendar) can significantly affect the movement of the currency pair. Therefore, during their release, trading should be done with utmost caution, or traders should exit the market to avoid sharp price reversals against the previous movement.
Beginning traders in the forex market should remember that not every trade can be profitable. Developing a clear strategy and effective money management are the keys to long-term trading success.