Analysis Of Trades On Monday:
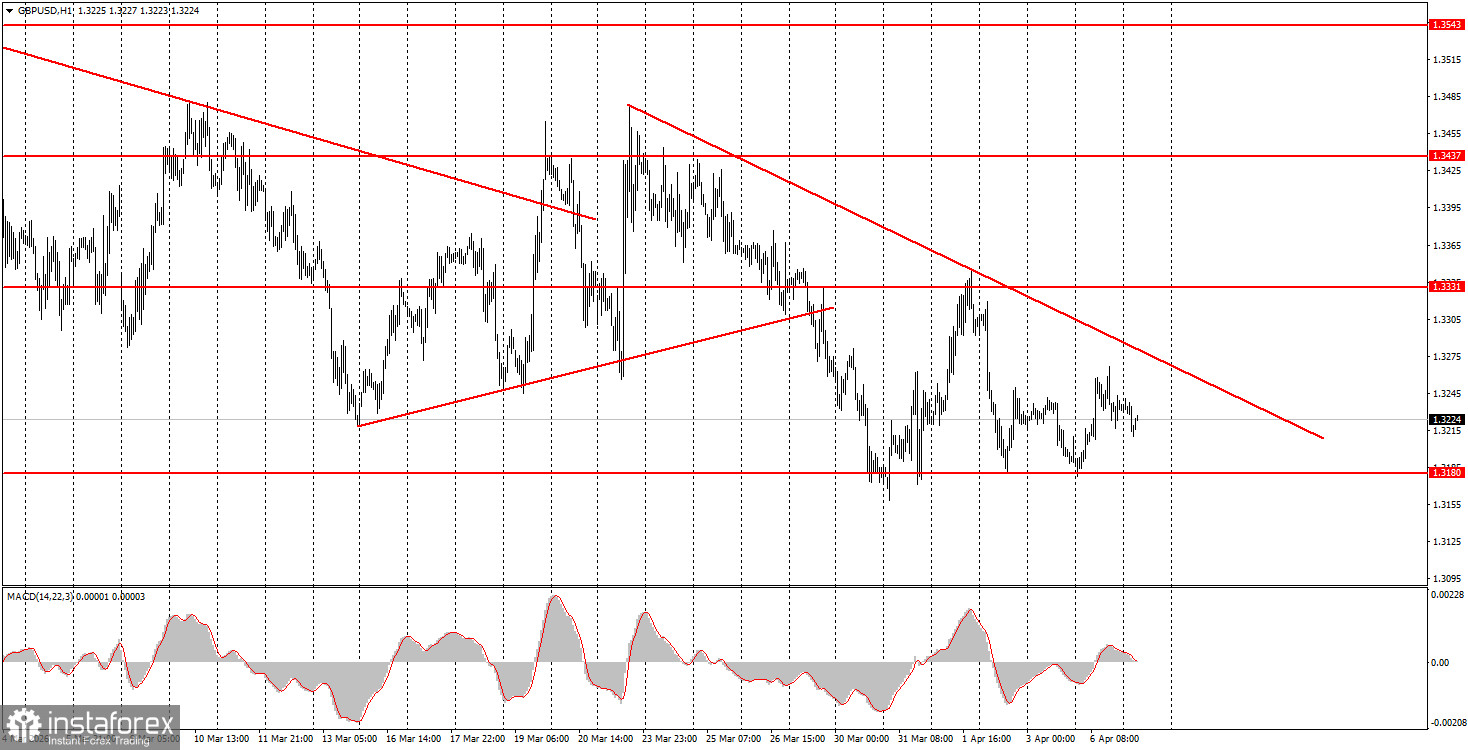
1H Chart Of The GBP/USD Pair
The GBP/USD pair traded in both directions throughout Monday. The macroeconomic backdrop was once again conveniently ignored by the market. Recall that on Friday, important reports like Non-Farm Payrolls and the unemployment rate had no effect on the dollar's exchange rate, while on Monday, the ISM index for services emerged. The ISM index came in at 54.0, below expectations, so we should have seen the dollar decline and the pair rise during the American trading session. However, in reality, we observed the opposite movement. This evening, another deadline for Donald Trump is expiring, so a new operation by the US Navy and Air Force to destroy Iran's infrastructure may begin in the Middle East. Shortly thereafter, Iran may initiate its response operation to destroy the infrastructure of countries in the Middle East that support the US. Thus, the dollar could begin to rise again at any moment.
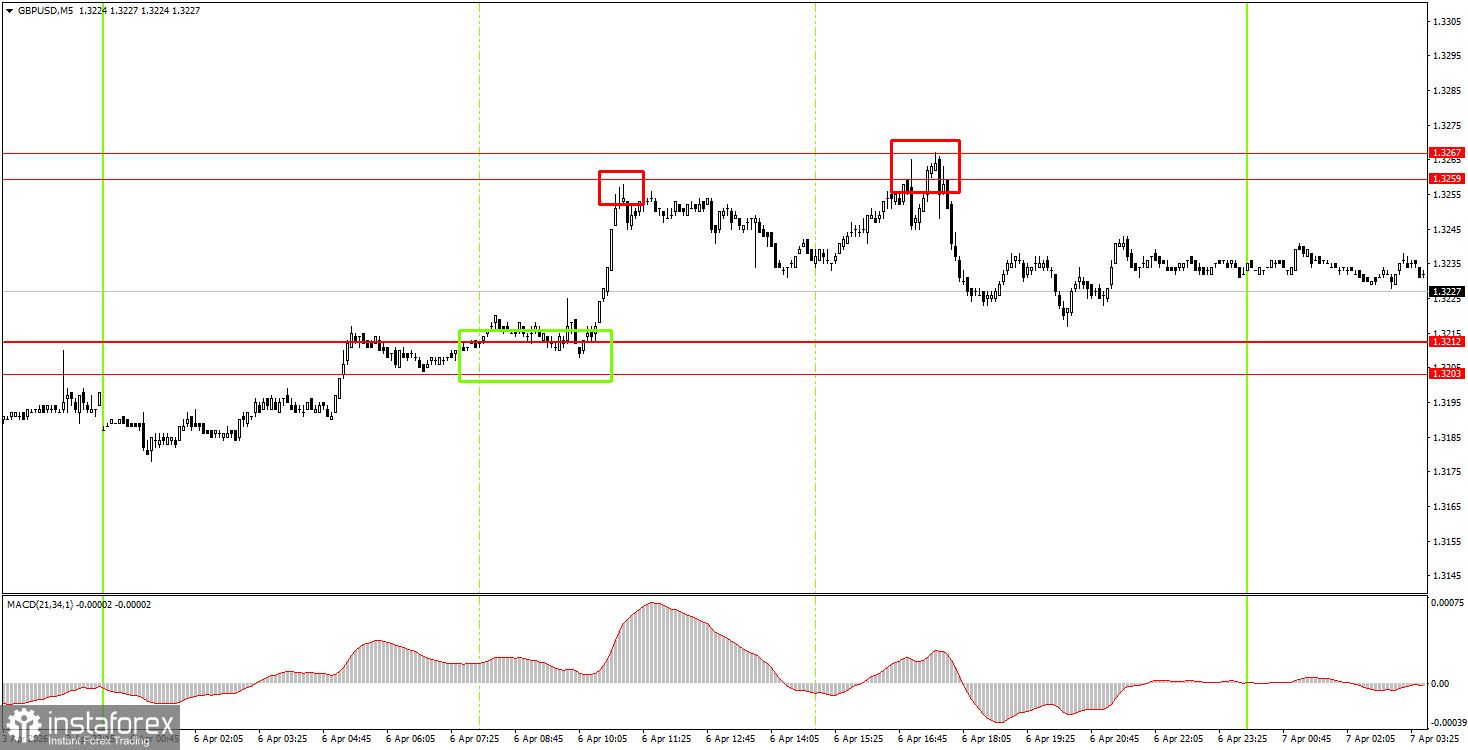
5M Chart Of The GBP/USD Pair
On the 5-minute time frame on Monday, three trading signals were formed. At the start of the European trading session, the pair bounced off the 1.3203-1.3212 range, allowing beginner traders to open long positions. In just half an hour, the area of 1.3259-1.3267 was tested with minimal deviation. The bounce from this area allowed for short positions to be opened, but a few hours later, the price returned to it. The second bounce provided another opportunity to open shorts, which could be manually closed profitably by the end of the day. Two out of three trades were profitable.
How To Trade On Tuesday:
On the hourly time frame, another downward trend is forming for the GBP/USD pair. There are no global reasons for a medium-term rise in the dollar, so in 2026, we expect a renewal of the global upward trend from 2025. However, for this to happen, geopolitical tensions worldwide need to begin to ease, because the dollar is currently in demand solely on geopolitical grounds.
On Tuesday, beginner traders can open new short positions if the price consolidates below the 1.3175-1.3180 area or bounces off the 1.3259-1.3267 area. Consolidation above the area of 1.3259-1.3267 or a bounce from 1.3175-1.3180 will allow for long positions to be opened.
On the 5-minute time frame, trading can currently be done at the levels of 1.3096-1.3107, 1.3175-1.3180, 1.3259-1.3267, 1.3319-1.3331, 1.3403-1.3407, 1.3437-1.3446, 1.3484-1.3489, 1.3529-1.3543, 1.3643-1.3652, 1.3695, 1.3741-1.3751. Today, there are no important events planned in the UK, while in the US, an important report on durable goods orders is scheduled. However, this report may also be ignored, just like the Non-Farms on Friday and the ISM index on Monday.
Key Principles of the Trading System:
- The strength of the signal is determined by the time it took to form the signal (bounce or level breakthrough). The shorter the time, the stronger the signal.
- If two or more trades were opened around any level based on false signals, all subsequent signals from that level should be ignored.
- In a range, any pair can generate a lot of false signals or may not generate them at all. Technical levels may be ignored.
- On the hourly timeframe, it is advisable to trade signals from the MACD indicator only when there is good volatility and a trend that is confirmed by a trendline or trend channel.
- If two levels are located too close together (5-20 pips apart), they should be considered a support or resistance area.
- After moving 15 pips in the correct direction, a Stop Loss should be set to breakeven.
What to Look for on the Charts:
Price levels of support and resistance are levels that serve as targets when opening buys or sells. Take Profit levels can be placed around them.
Red lines represent channels or trend lines that show the current trend and indicate the direction in which it is preferable to trade now.
The MACD indicator (14,22,3) – the histogram and the signal line – is a supporting indicator that can also be used as a source of signals.
Important speeches and reports (always included in the news calendar) can significantly affect the movement of the currency pair. Therefore, during their release, trading should be done with utmost caution, or traders should exit the market to avoid sharp price reversals against the previous movement.
Beginning traders in the forex market should remember that not every trade can be profitable. Developing a clear strategy and effective money management are the keys to long-term trading success.