empty
 
 
25.09.2025 10:25 AM
Forecast for EUR/USD on September 25, 2025
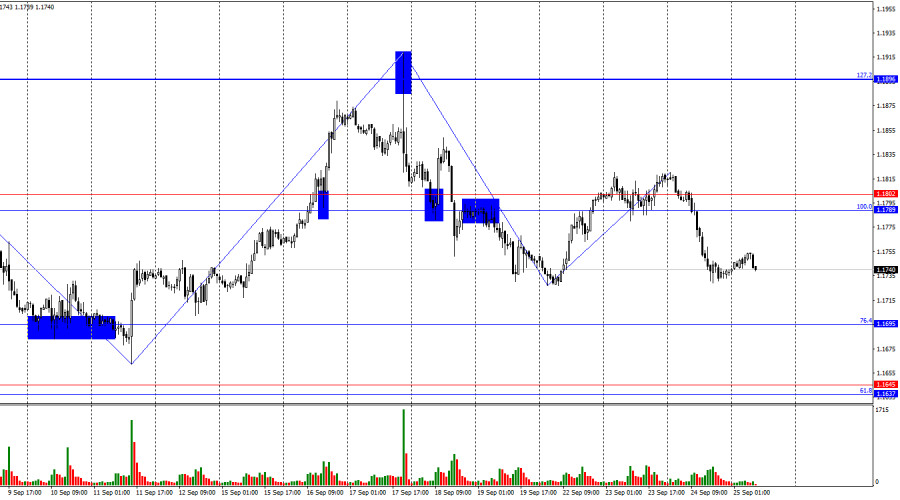
On Wednesday, the EUR/USD pair formed a new reversal in favor of the U.S. dollar and consolidated below the 1.1789–1.1802 zone. Thus, the decline may continue today toward the 76.4% Fibonacci level at 1.1695. A rebound from this level would favor the euro and growth toward the resistance zone of 1.1789–1.1802.

This image is no longer relevant

The wave situation on the hourly chart remains simple and clear. The last completed downward wave did not break the low of the previous wave, and the last upward wave did not break the previous peak. Therefore, the trend remains "bullish" at this time. The latest labor market data and the changed Fed monetary policy outlook support bullish traders, but the bears are finding reasons to counterattack. For the trend to switch to "bearish," the pair needs to fall to the 1.1637–1.1645 support zone.

On Wednesday, the news background was virtually absent. However, the bears reinterpreted Jerome Powell's speech on Tuesday evening and concluded that the FOMC Chair could have voiced more "dovish" points. Traders seem to have expected the Fed to focus more heavily on U.S. labor market weakness, which forces easing at a fairly high pace. However, Powell emphasized the importance of the regulator's dual mandate. Inflation also remains a concern for FOMC members and prevents rate cuts at every meeting or larger than 0.25% at once. In my view, this factor is too weak to sustain the bears, and yesterday's decline in the pair was more than enough to price it in. However, today an important U.S. GDP report for Q2 will be released, which may trigger new bearish attacks. Recall that the second estimate was raised to 3.3% q/q, and the final estimate may be even higher. The U.S. economy is expanding, but many economists remain skeptical.

This image is no longer relevant

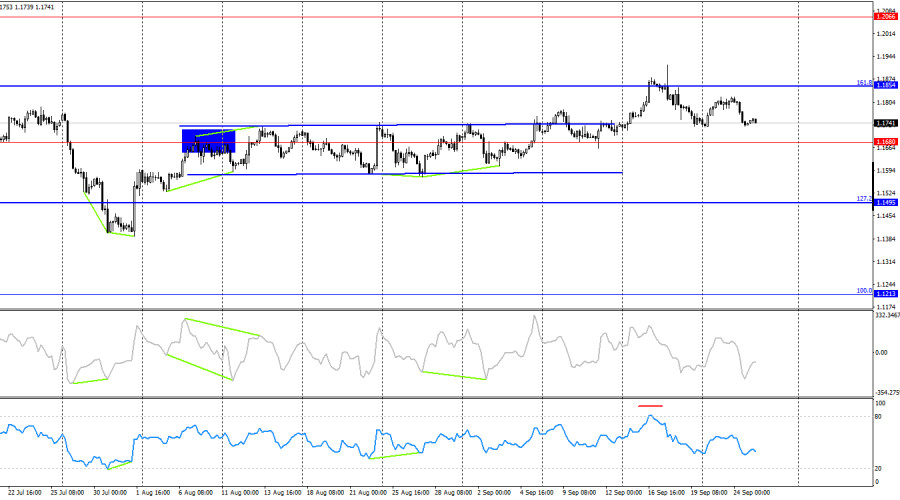
On the 4-hour chart, the pair consolidated above the horizontal corridor, allowing traders to expect further growth. A rebound from the 161.8% Fibonacci level at 1.1854 worked in favor of the U.S. dollar and led to some decline toward 1.1680. A rebound from 1.1680 would allow traders to count on renewed growth. No looming divergences are currently observed on any indicators.

Commitments of Traders (COT) report:

This image is no longer relevant

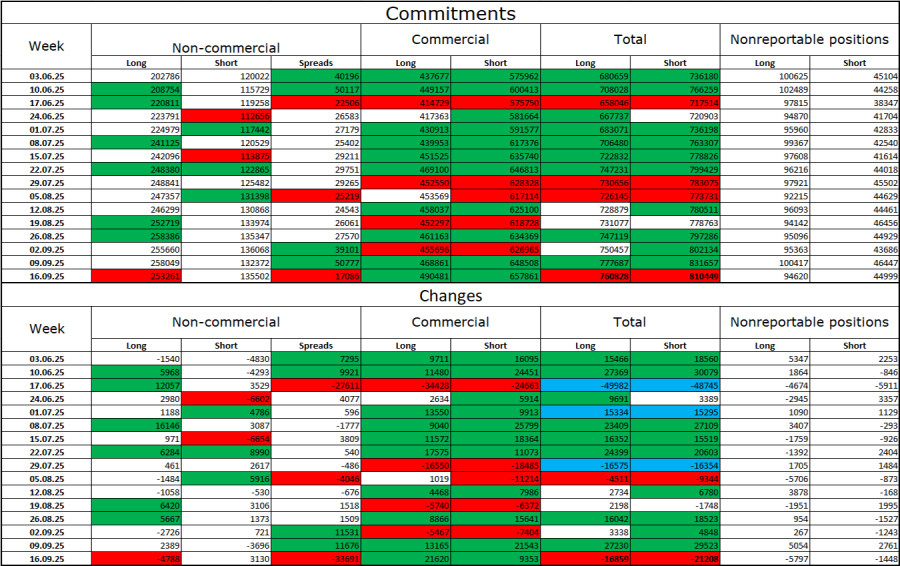
During the last reporting week, professional traders closed 4,788 long positions and opened 3,130 short positions. The sentiment of the "Non-commercial" group remains "bullish" thanks to Donald Trump and continues to strengthen over time. The total number of long positions held by speculators now stands at 253,000, compared with 135,000 short positions. The gap is essentially twofold. In addition, note the number of green cells in the table above. They reflect strong position building in the euro. In most cases, interest in the euro continues to rise, while interest in the dollar declines.

For 32 consecutive weeks, large players have been reducing short positions and building long positions. Donald Trump's policies remain the most significant factor for traders, as they could create long-term and structural problems for America. Despite the signing of several important trade agreements, many key economic indicators are showing decline.

News calendar for the U.S. and the Eurozone:

  • Eurozone – Germany Consumer Confidence Index (06:00 UTC).
  • U.S. – Change in durable goods orders (12:30 UTC).
  • U.S. – Change in GDP for Q2 (12:30 UTC).
  • U.S. – Change in initial jobless claims (12:30 UTC).
  • U.S. – Existing home sales (14:00 UTC).

On September 24, the economic calendar contains five entries, two of which can be considered important. The influence of the news background on market sentiment will be present on Thursday in the second half of the day.

EUR/USD forecast and trading tips:

Sales of the pair were possible after closing below the 1.1789–1.1802 support zone on the hourly chart, with a target at 1.1695. Today, these trades can be kept open, setting Stop Loss at breakeven. Purchases will be possible today on a rebound from 1.1695 or after closing above the 1.1789–1.1802 zone.

The Fibonacci grids are built from 1.1789–1.1392 on the hourly chart and from 1.1214–1.0179 on the 4-hour chart.

Samir Klishi,
InstaForex के विश्लेषणात्मक विशेषज्ञ
© 2007-2025
Summary
Urgency
Analytic
Grigory Sokolov
Start trade
Earn on cryptocurrency rate changes with InstaForex
Download MetaTrader 4 and open your first trade
  • Grand Choice
    Contest by
    InstaForex
    InstaForex always strives to help you
    fulfill your biggest dreams.
    कॉन्टेस्ट में हिस्सा लें
  • चैन्सी डिपॉजिट
    $ 3,000 के साथ अपना खाता जमा करें और प्राप्त करें $3000 अधिक!
    में सितंबर हम आकर्षित करते हैं $3000 चैंसी डिपॉज़िट में
    ट्रेडिंग अकाउंट में $ 3,000 जमा करके जीतने का अवसर प्राप्त करें इस शर्त को पूरा करके आप प्रतियोगिता में भाग ले सकते हैं
    कॉन्टेस्ट में हिस्सा लें
  • ट्रेड वाइज़, विन डिवाइस
    कम से कम $500 के साथ अपने खाते में टॉप अप करें, कॉन्टेस्ट के लिए साइन अप करें और मोबाइल डिवाइस जीतने का मौका पाएं।
    कॉन्टेस्ट में हिस्सा लें
  • 100% बोनस
    अपनी जमा राशि पर 100% बोनस प्राप्त करने का आपका अनूठा अवसर
    बोनस पायें
  • 55% बोनस
    अपनी प्रत्येक डिपॉजिट पर 55% बोनस के लिए आवेदन करें
    बोनस पायें
  • 30% बोनस
    हर बार खाता टॉप अप करने पर 30% बोनस प्राप्त करें
    बोनस पायें

अनुशंसित लेख

अभी बात नहीं कर सकते?
अपना प्रश्न पूछें बातचीत.
Widget callback