EUR/USD 5-Minute Analysis
The EUR/USD currency pair continued its downward movement on Thursday, which was entirely justified this time. The day before, the European currency had been falling for inexplicable reasons, but on Thursday, everything was logical. In the US, important data on Q2 GDP and durable goods orders were published in the afternoon, and both reports delivered strong numbers. The American economy grew not by 3.3% as expected, but by 3.8%. Durable goods orders rose by 2.9% versus forecasts of -0.5%. As a result, the pair exhibited the expected movement.
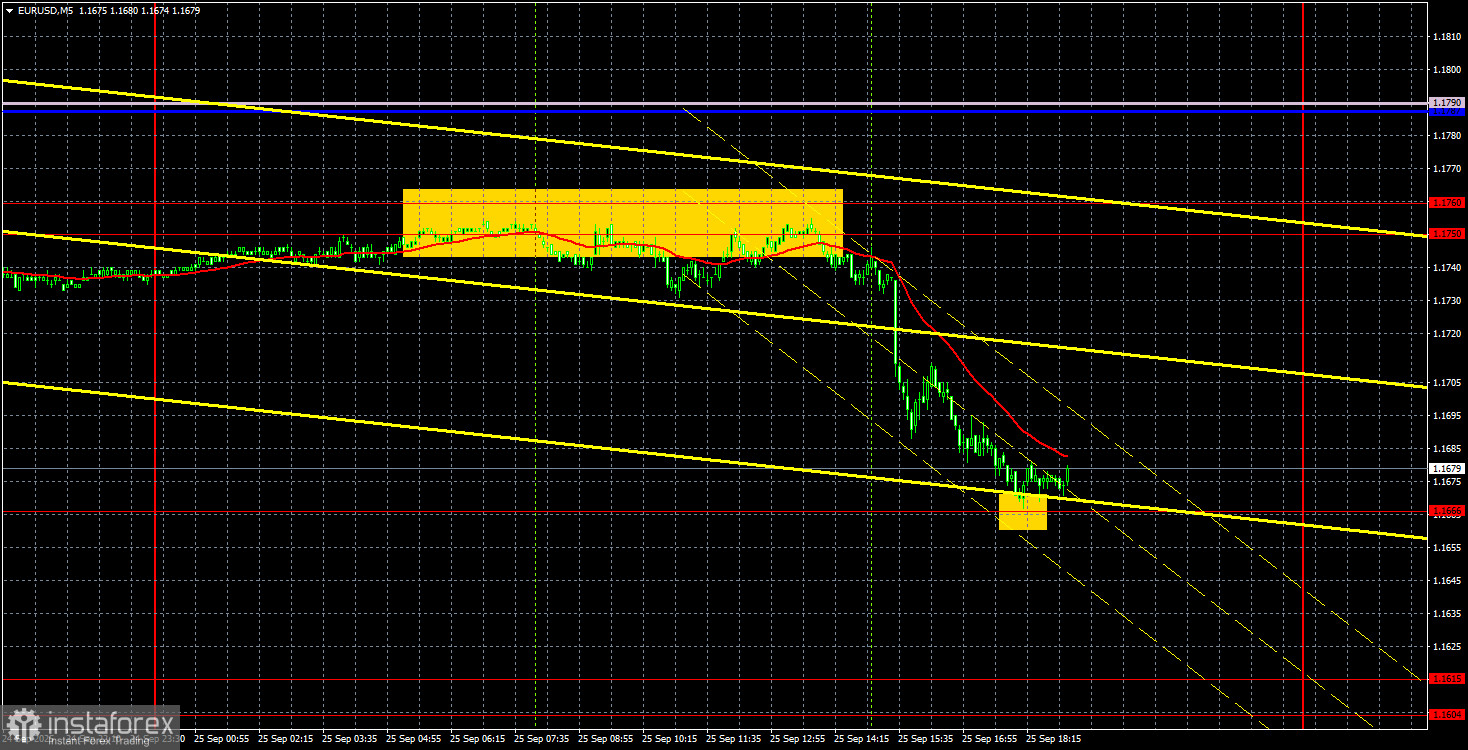
We believe that the growth of the American economy is somewhat artificial; however, the fact of growth itself cannot be denied. If the dollar falls on negative macroeconomic data, it should rise in response to positive ones. The day before, the price consolidated below the 1.1750-1.1760 area as well as below the trend line. Therefore, from a technical standpoint, the southward movement was completely natural.
On the 5-minute timeframe, there was one excellent sell signal in the 1.1750-1.1760 area during the previous day. The price traded along this area for the entire European session but eventually bounced down from it. Just a few hours later, the nearest target level of 1.1666 was reached. Thus, this trade could have yielded about 60 points with minimal risk.
COT Report
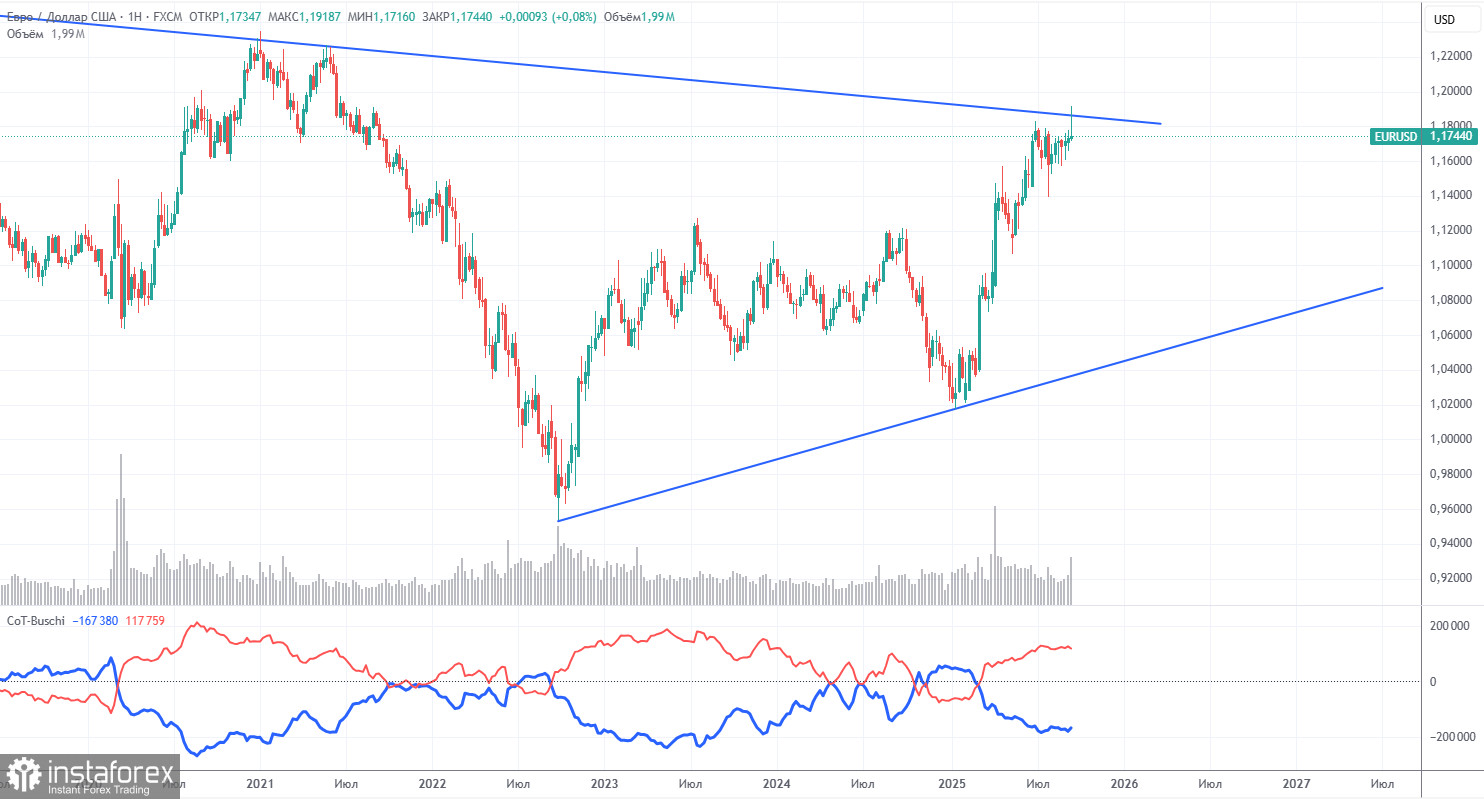
The latest COT report is dated September 16. The chart above clearly shows that the net position of non-commercial traders had long been bullish, with the bears only barely gaining the upper hand at the end of 2024—and they quickly lost it. Since Trump took office for a second time, the dollar has been the only one to fall. We can't say with 100% certainty that the dollar's decline will continue, but global events point to this scenario.
We still don't see any fundamental factors supporting the euro, but there remain plenty of reasons for the dollar to fall. The global downward trend remains intact, but at this point, what difference does it make that the price has been relatively stable for the past 17 years? Once Trump ends his trade wars, the dollar may be able to rally; however, recent developments indicate that trade wars will likely continue in one form or another. The potential loss of Fed independence is another major factor weighing on the US currency.
The red and blue lines of the indicator still point to a bullish trend. During the last reporting week, the "Non-commercial" group's number of longs dropped by 4,800, while shorts increased by 3,100, bringing the net position down by 7,900 contracts for the week.
EUR/USD 1-Hour Analysis
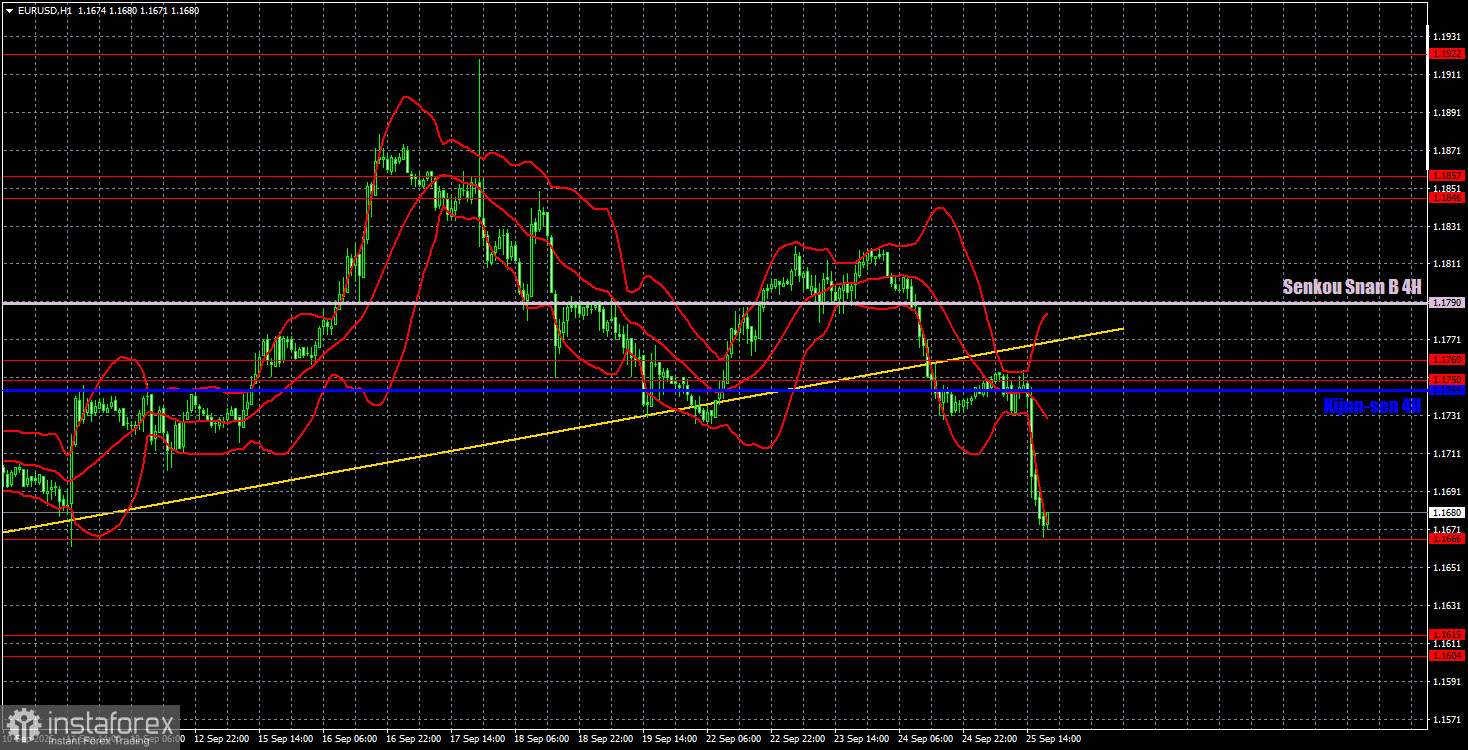
On the hourly timeframe, the EUR/USD pair has canceled its local uptrend. Now a downtrend is forming. Still, we see no reason for a prolonged dollar rally. On the daily timeframe, it is clear that the uptrend remains, while the strengthening of the American currency is relatively weak. On the lower timeframes, the US currency is rising, but it is unclear how long this trend will last.
For September 26, we highlight the following levels for trading: 1.1234, 1.1274, 1.1362, 1.1426, 1.1534, 1.1604-1.1615, 1.1666, 1.1750-1.1760, 1.1846-1.1857, 1.1922, 1.1971-1.1988, as well as the Senkou Span B line (1.1790) and the Kijun-sen line (1.1744). The lines of the Ichimoku indicator can shift during the day, which should be considered when detecting trade signals. Remember to set a Stop Loss to breakeven if the price moves in your favor by 15 pips. This will safeguard you from potential losses if the signal proves to be false.
On Friday, ECB President Christine Lagarde will speak in the Eurozone. In the US, reports on personal income and expenditures, the PCE index, and the University of Michigan consumer sentiment index will be published. All these events could trigger a market reaction, just as we saw yesterday.
Trading Recommendations
On Friday, the downward movement may continue, but traders can simply trade by signals. It is not worth ruling out upward movement completely, nor ignoring US macroeconomic data. The pair's dynamics on Friday will depend on several factors, so it does not make sense to try to predict the price direction in advance.
Illustration Explanations:
- Support and resistance price levels – thick red lines where movement may end. They are not trading signal sources.
- Kijun-sen and Senkou Span B lines—These are strong Ichimoku indicator lines transferred to the hourly timeframe from the 4-hour one.
- Extremum levels – thin red lines where the price has previously rebounded. These act as trading signal sources.
- Yellow lines – trend lines, trend channels, and other technical patterns.
- Indicator 1 on the COT charts – the size of the net position for each category of traders.