The EUR/USD currency pair found no reasons for active movement for most of Tuesday. In the morning, the European Union and Germany released what were almost the only macroeconomic data this week, but as has often been the case lately, they turned out to be contradictory. While the business activity indices in the manufacturing sectors fell again and dropped below the "waterline" of 50.0, the services sector indices rose and exceeded expert forecasts. Taken together, the results were neutral, so the market showed no reaction.
The euro maintains an upward bias, but it remains rather weak. The price keeps pulling back, repeatedly breaking through the moving average, which often only confuses traders. However, market participants may already have become accustomed to this type of movement, as it has lasted for over a month. Thus, another consolidation above the moving average line could mean that we will see a new wave of upward movement above the previous local high.
In general, we have little to add regarding the current EUR/USD analysis. The dollar's position remains catastrophic, even though it has been losing ground rather slowly in recent months. But it is still losing! Most of the global fundamental factors continue to work against the U.S. currency, so it still cannot expect anything positive.
In our view, the key factor at the moment remains the "rate divergence" between the ECB and the Fed, which will continue to shrink in the coming months and years. If the U.S. dollar fell actively while the ECB was easing monetary policy, what can it count on when the Fed begins to ease monetary policy?
The only factor that may play in favor of the U.S. currency is the Supreme Court, which in early November may finally block most of Donald Trump's tariffs. If that happens, the trade war could come to an end. But for how long? How much time will pass before Donald Trump reinstates all the duties, simply relying on another law? How many more appeals will Trump file just to slow down the verdict process? In our opinion, the trade war will not end so easily. Nor will the war against the Fed.
The Fed has fewer trump cards in hand than the U.S. Supreme Court. All members of the Monetary Committee will eventually retire, and Trump does not need to replace the entire Committee. It is enough to win over just a few more officials so that the Committee votes meeting after meeting the way the White House wants. Thus, Trump may win on this front, but most likely only in 2026.
Therefore, until November, the dollar may feel more or less stable. But in any case, it will still remain under market pressure due to Fed monetary easing. On the daily timeframe, it is clearly visible that the pair has been rising for nine consecutive months, with almost no corrections during this time. At the moment, there are still no grounds to expect strengthening of the U.S. currency.
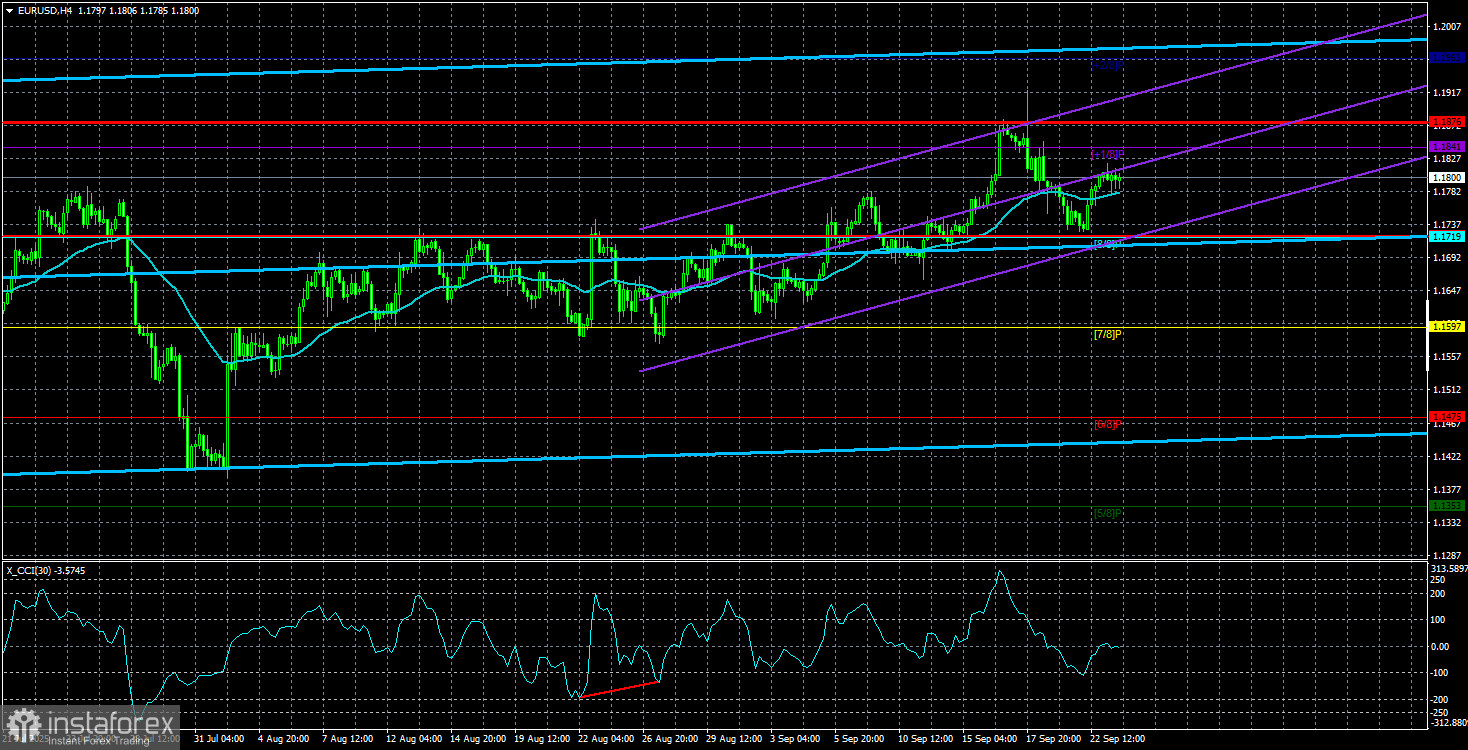
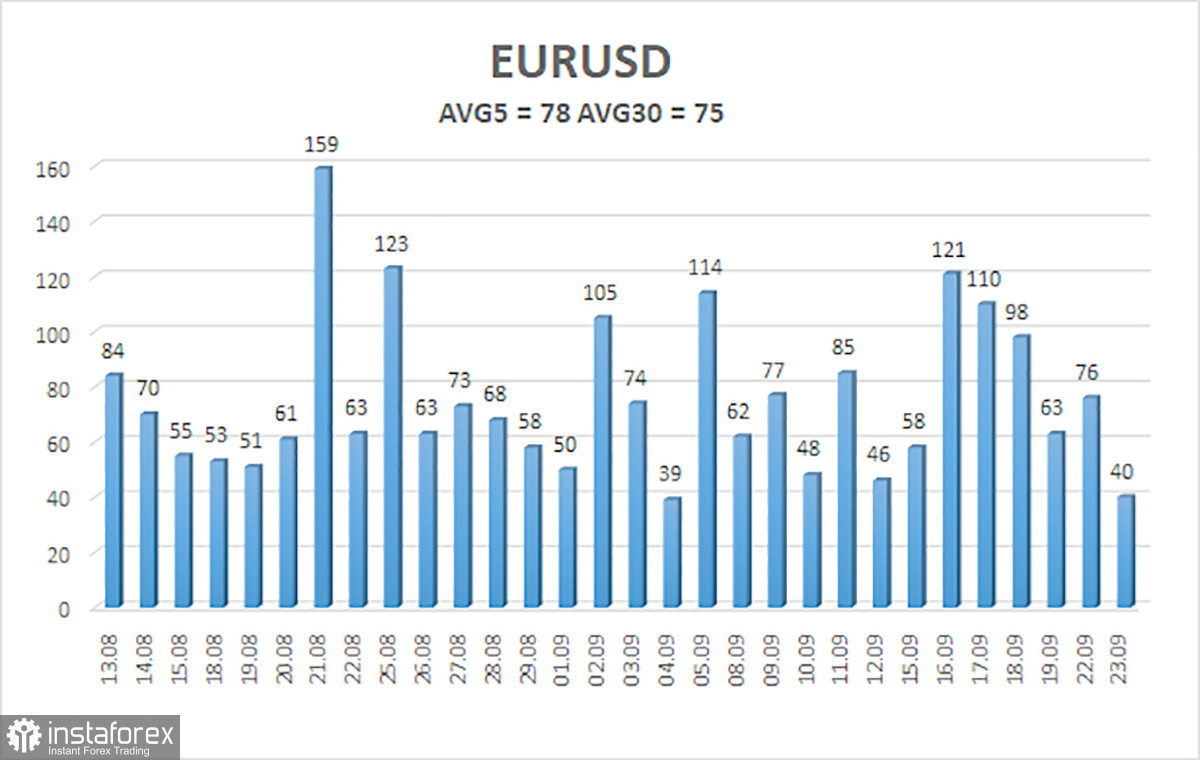
The average volatility of the EUR/USD pair over the last 5 trading days, as of September 24, is 78 points and is characterized as "average." We expect the pair to move between the 1.1720 and 1.1876 levels on Wednesday. The senior linear regression channel is directed upward, which still indicates an uptrend. The CCI indicator entered the overbought zone last week, which may have triggered a new round of downward correction. Currently, a new "bullish" divergence has formed.
Nearest support levels: S1 – 1.1719 S2 – 1.1597 S3 – 1.1475
Nearest resistance levels: R1 – 1.1841 R2 – 1.1963
Trading recommendations: The EUR/USD pair has started a new wave of corrective movement; however, the uptrend remains intact, which is visible on all timeframes. The U.S. currency is still strongly influenced by Donald Trump's policies, and he is not going to "stop at what has been achieved." The dollar grew as much as it could (for a whole month), but now it seems time has come for a new round of prolonged decline. If the price remains below the moving average, short positions can be considered with targets at 1.1719 and 1.1597 on purely technical grounds. Above the moving average line, long positions remain relevant with targets at 1.1876 and 1.1963 in line with the trend.
Explanations for illustrations:
- Linear regression channels help determine the current trend. If both point in the same direction, the trend is strong.
- Moving average line (settings 20.0, smoothed) defines the short-term trend and the direction in which trading should be conducted.
- Murray levels are target levels for movements and corrections.
- Volatility levels (red lines) indicate the probable price channel in which the pair will trade over the next day, based on current volatility indicators.
- CCI indicator – entering the oversold area (below -250) or overbought area (above +250) signals that a trend reversal in the opposite direction is approaching.